Enabling audit logs and viewing reports
Enabling audit logs on the server
Audit logging is a mechanism to track all of the actions that occur inside your application. Audit Logging in Voyager Server provides two main benefits.
-
It is possible to build a detailed audit trail of every action that has occured in the application. This can also include information about the user that performed the action, and the mobile device they were using.
-
The data from the audit logs can be aggregated and visualised to provide more insight into how your application is used.
Audit Logging Architecture
Audit logging can be enabled in Voyager Server using the @aerogear/voyager-audit module. When enabled, all actions such as GraphQL mutations, queries and subscriptions are logged in great detail to stdout in JSON format.
An audit log example message is shown below.
{
  "level": 30,
  "time": 1545385687476,
  "pid": 11889,
  "hostname": "localhost.localdomain",
  "tag": "AUDIT",
  "logType" "RESOLVER_COMPLETION",
  "msg": "",
  "operationType": "query",
  "fieldName": "hello",
  "parentTypeName": "Query",
  "path": "hello",
  "success": true,
  "arguments": {},
  "clientInfo": {
    "clientId": "848d2a10-0505-11e9-888f-8d166149101a",
    "timestamp": 1545385686843,
    "data": {
      "app": {
        "appId": "org.aerogear.sync.example",
        "appVersion": "0.0.1",
        "sdkVersion": "0.0.1",
        "framework": "cordova"
      },
      "device": {
        "platform": "android",
        "platformVersion": "9",
        "device": "General Mobile GM8 Pro"
      }
    }
  },
  "userInfo": {
    "jti": "6ae0966a-9d61-430b-8167-d2b3c0b42709",
    "exp": 1545761725,
    "nbf": 0,
    "iat": 1545725725,
    "iss": "http://localhost:8080/auth/realms/voyager-testing",
    "aud": "voyager-testing",
    "sub": "ea2312e9-1aae-4b67-8674-a3aacf20a71d",
    "typ": "Bearer",
    "azp": "voyager-testing",
    "auth_time": 1545725725,
    "session_state": "1ba4d429-8010-4f38-8002-9cc72550850d",
    "acr": "1",
    "allowed-origins": [
      "*"
    ],
    "realm_access": {
      "roles": [
        "admin",
        "uma_authorization"
      ]
    },
    "resource_access": {
      "voyager-testing": {
        "roles": [
          "admin"
        ]
      },
      "account": {
        "roles": [
          "manage-account",
          "manage-account-links",
          "view-profile"
        ]
      }
    },
    "name": "Ali Ok",
    "preferred_username": "developer",
    "given_name": "Ali",
    "family_name": "Ok",
    "email": "aliok@example.com"
  },
  "v": 1
}
The clientInfo property of the audit log message is available only if the client is sending the client information to Voyager Server. That has to be enabled separately in the client. Additionally, data in that property can only be collected if the app is a Cordova app or a native app. Simple web clients cannot get the device, client nor app details and cannot send this information.
The userInfo property is available only if Voyager Server is protected by an identity manager, such as Keycloak, and if the user is authenticated. See see [sync-server-auth].
Enabling Audit Logging in Voyager Server
Audit logging is enabled in Voyager Server using the @aerogear/voyager-audit
-
Import the
@aerogear/voyager-auditmoduleconst auditLogger = require('@aerogear/voyager-audit') -
Inject the auditLogger module into the Voyager Server. This enables audit logging within your application.
const voyagerConfig = {
  auditLogger
}
const server = VoyagerServer(apolloConfig, voyagerConfig)
The Audit Logging Example Server Guide has an example server based off the instructions above and shows all of the steps needed to get it running.
Alternatively, if the default audit logger does not match your requirements, you can create an audit logger that implements the AuditLogger interface as defined below.
AuditLogger interfaceexport interface AuditLogger {
logResolverCompletion(msg: string, success: boolean, obj: any, args: any, context: any, info: GraphQLResolveInfo): void
logConflict (msg: string, serverData: any, clientData: any, obj: any, args: any, context: any, info: GraphQLResolveInfo): void
auditLog(msg: string, obj: any, args: any, context: any, info: GraphQLResolveInfo): void
}The following example implements an AuditLogger and injects it into the Voyager Server.
The example redacts the arguments using a myCustomRedactionFunction function.
const { buildPath } = require('@aerogear/voyager-tools')
// ...

const auditLogger = {
  auditLog: function(msg, obj, args, context, info){
    console.log(JSON.stringify(
      {
        audit: {
          tag: 'AUDIT',
          logType: logType,
          msg: msg || '',
          requestId: context && context.request ? context.request.id : '',
          operationType: info.operation.operation,
          fieldName: info.fieldName,
          parentTypeName: info.parentType.name,
          path: buildPath(info.path),
          parent: obj,
          arguments: myCustomRedactionFunction(args),
          clientInfo: context && context.request && context.request.body && context.request.body.extensions && context.request.body.extensions.metrics || undefined,
          authenticated: !!(context && context.auth && context.auth.isAuthenticated()),
          userInfo: (context && context.auth && context.auth.accessToken) ? context.auth.accessToken.content : undefined
        }
      }
    ));
  },

  logResolverCompletion: function(msg, success, obj, args, context, info){
    console.log(JSON.stringify(
      {
        audit: {
          tag: 'AUDIT',
          logType: 'RESOLVER_COMPLETION',
          msg: msg || '',
          requestId: context && context.request ? context.request.id : '',
          operationType: info.operation.operation,
          fieldName: info.fieldName,
          parentTypeName: info.parentType.name,
          path: buildPath(info.path),
          success,
          parent: obj,
          arguments: myCustomRedactionFunction(args),
          clientInfo: context && context.request && context.request.body && context.request.body.extensions && context.request.body.extensions.metrics || undefined,
          authenticated: !!(context && context.auth && context.auth.isAuthenticated()),
          userInfo: (context && context.auth && context.auth.accessToken) ? context.auth.accessToken.content : undefined
        }
      }
    ));
  },

  logConflict: function (msg, serverData, clientData, obj, args, context, info) {
    console.log(JSON.stringify(
      {
        audit: {
          tag: 'AUDIT',
          logType: LOG_TYPE_CONFLICT,
          msg: msg || '',
          requestId: context && context.request ? context.request.id : '',
          operationType: info.operation.operation,
          fieldName: info.fieldName,
          parentTypeName: info.parentType.name,
          path: buildPath(info.path),
          parent: obj,
          arguments: myCustomRedactionFunction(args),
          clientInfo: context && context.request && context.request.body && context.request.body.extensions && context.request.body.extensions.metrics || undefined,
          authenticated: !!(context && context.auth && context.auth.isAuthenticated()),
          userInfo: (context && context.auth && context.auth.accessToken) ? context.auth.accessToken.content : undefined,
          conflict: true,
          conflictData: {
            message: msg,
            myCustomRedactionFunction(serverData),
            myCustomRedactionFunction(clientData),
          }
        }
      }
    ));
  }
}

// ...

const voyagerConfig = {
  auditLogger
}
const server = VoyagerServer(apolloConfig, voyagerConfig)
Sending Device Information in Voyager Client
See the Voyager Client Audit Logs section for more information.
Exploring Audit Logs
Voyager Server simply prints audit logs to stdout and it is the responsibility of another component to pick up these logs and provide
functionality to the user to make use of the logs.
The EFK stack (ElasticSearch, Fluentd and Kibana) on OpenShift is the recommended solution in this guide. We provide Kibana dashboards with a number of useful visualisations and insights into Voyager Server.
All application logs printed to stdout are sent to ElasticSearch by Fluentd. However, the audit log messages printed by @aerogear/voyager-audit are printed in a format that is used by the Kibana dashboards.
Configuring OpenShift Logging
OpenShift logging can be enabled as described in OpenShift documentation.
Once enabled, OpenShift logging will create a Fluentd instance per cluster node that reads the stdout and stderr of the pods in that node
and pushes the readings to the centralized ElasticSearch instance. Documents created in ElasticSearch instance can be then explored and
visualized by the Kibana instance, which is also installed by OpenShift logging.
OpenShift logging creates an index per namespace and that index is only available to users who have access to that namespace. It also creates the index patterns in Kibana in the same way.
By default, OpenShift also provides a curator which deletes the old log messages from ElasticSearch to reduce storage needs and improve performance. This has an impact on audit trails and also metrics.
For long term audit trails, curator can be configured to delete messages older than your choice. If this is not sufficient, Fluentd can be configured to write log messages to a separate storage, such as S3.
In terms of metrics, curator’s deletion age config should not be set shorter than the desired time range that you would like to see the metrics for.
Importing Kibana Saved Objects
Kibana is a visualization tool that has a great integration with ElasticSearch.
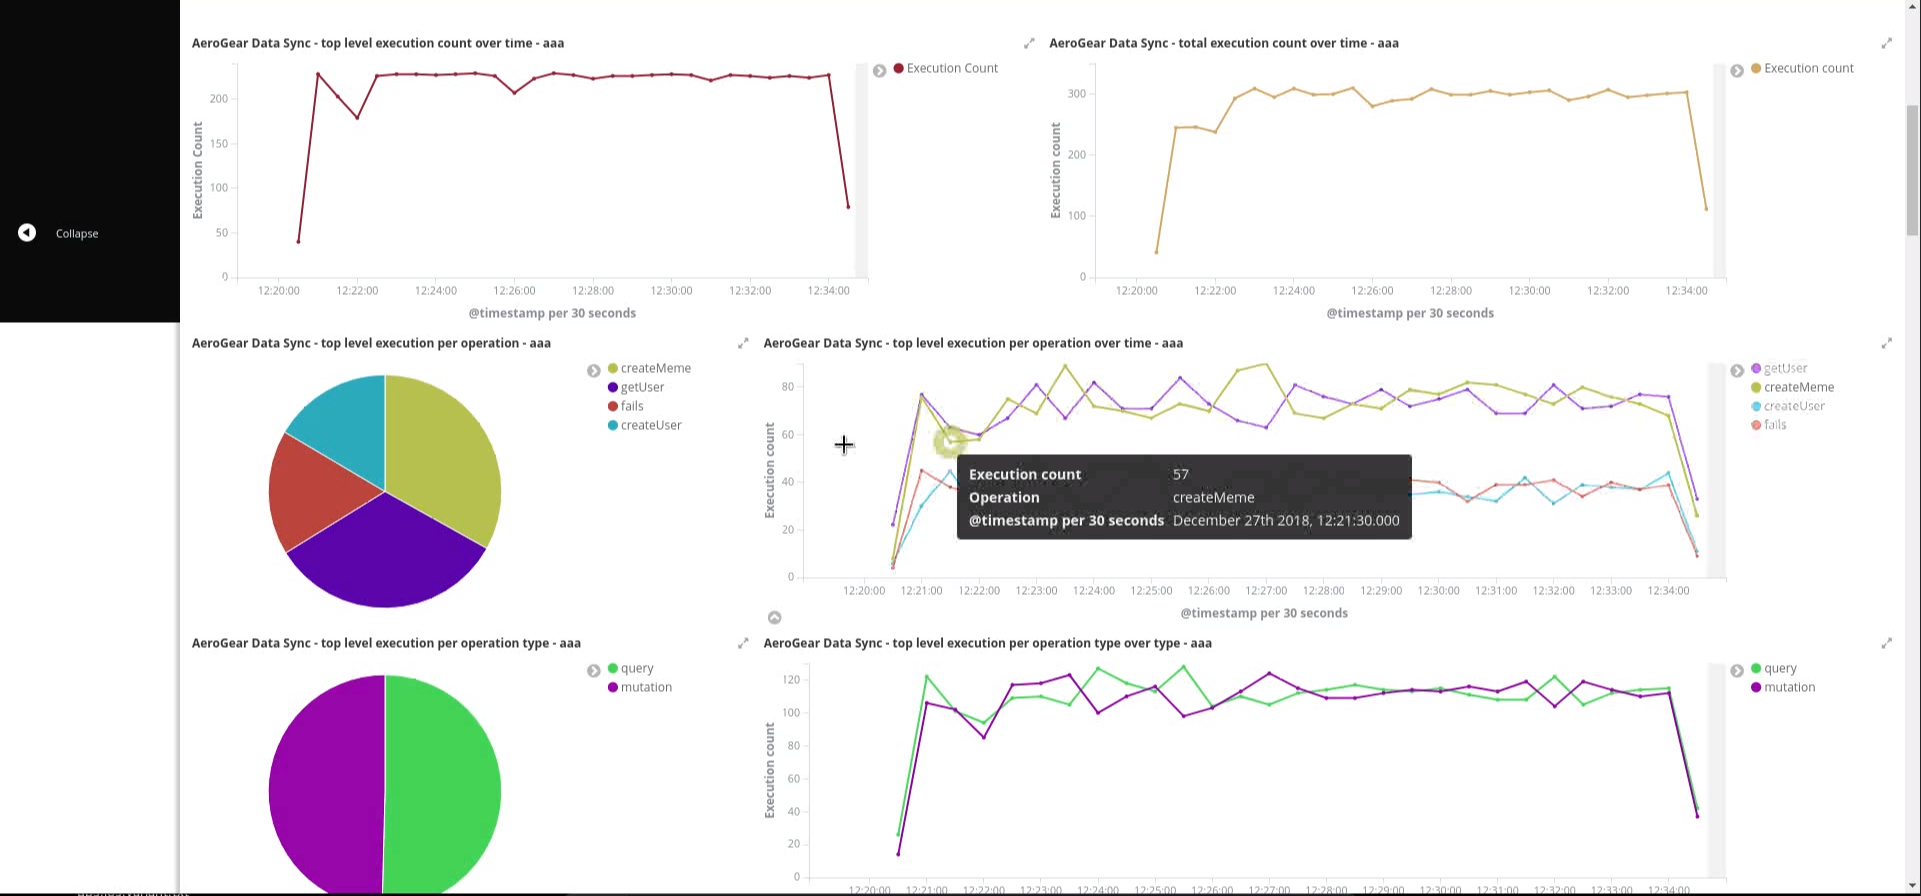
A template for Kibana saved objects is available. When the saved objects are imported, a number of saved searches, visualizations and a dashboard are created in Kibana. These then can be used to have an overview of the Voyager application.
See the screenshot of the provided dashboard below.
OpenShift logging creates ElasticSearch indices per namespace and the index names have the format project.<project-name>.<project-uid>.
For example project.myproject.49f9a0b6-09b5-11e9-9597-069f7827c758.
It also creates a Kibana index pattern for that index using the pattern project.<project-name>.<project-uid>.*.
In order to make sure the Kibana saved objects use the correct index pattern, project UID should be fetched and fed to the Kibana import template.
PROJECT_NAME=<your_project_name>
# login with your user that has access to your project
oc login
# get project UUID, which is used to build the index name
PROJECT_UUID=`oc get project $PROJECT_NAME -o go-template='{{.metadata.uid}}'`

# replace the placeholders in the template
sed \
    -e "s/<PROJECT_NAME>/${PROJECT_NAME}/g" \
    -e "s/<PROJECT_UUID>/${PROJECT_UUID}/g" \
 kibanaImportTemplate.json > kibanaImport.json
A template, kibanaImportTemplate.json is available from the Voyager GitHub repo.
Once the kibanaImport.json file is generated, import it into Kibana:
-
Open Kibana using
https://kibana.<domain>.com. Replace<domain>with the name of the cluster’s main domain. -
Click Management in the left
-
Click Saved Objects
-
Click Import and select
kibanaImport.json
Imported saved objects include the project name or the UID in their names, so that saved objects in differnt namespaces do not affect each other.
|
No index pattern is created in Kibana if there are no logs generated by an application. Also, if the fields referenced in the prepared Kibana saved objects do not exist, errors such as the following can be seen: Error: Importing AeroGear Data Sync - top level execution per platform - aaa (top_level_execution_per_platform_49f9a0b6-09b5-11e9-9597-069f7827c758) failed: Could not locate that index-pattern-field (id: audit.clientInfo.data.device.platform.raw) Error: Could not locate that index-pattern-field (id: audit.clientInfo.data.device.platform.raw) Because of these conditions, Kibana saved objects have to be imported after there are some audit logs already in ElasticSearch. At the moment, no mechanisms are provided to overcome this problem. |
Viewing the Dashboard and Audit Logs
When the Kibana saved objects are imported, a dashboard is available with several visualizations that can be used as an overview of the Voyager application status.
At the bottom of the dashboard, audit log messages can be explored directly.
For more information on how to use Kibana, see the Kibana documentation.
Enabling audit logs on the client
As described in the Server Audit Logs section, device information can be logged as part of an audit log message. To enable it:
-
The Cordova plugin
cordova-plugin-aerogear-metricshas to be installed so that the device, client and app information can be collected.cordova plugin add cordova-plugin-aerogear-metrics -
Set
auditLoggingto true when creating a client instance.import { createClient } from '@aerogear/voyager-client'; const config = { ... auditLogging: true, ... } return await createClient(config);